nmrAna
nmrAna is a Matlab-based tool for analysis of nuclear magnetic resonance (NMR) measurements. The program allows to analyse the entire series of measured spectra as a function of temperature and other parameters like Tau in case of spin-lattice time (T1) measurements.
Authors
- Anton Potočnik (IJS, F5)
- Andraž Krajnc (KI)
- Peter Jeglič (IJS, F5)
- Tomaž Apih (IJS, F5)
Features
- Automatic fast fourier transform from FID with auto phase and auto SHL option.
- Analysis of T1 and T2 measurements with fitting of magnetization curves (fminsearch)
- Analysis of pulse-length optimization measurements (D1)
- Analysis of frequency sweep measurements
- Linescan analysis (e.g. analyse T1 over the spectra line)
- Spectral component fitting using entire magnetization recovery measurements
- Extraction of spectra from magnetization recovery measurements
- Spectral moment analysis
- Plot of various experimental parameters
Analytical functions are defined in separate files, so one can easily add new functions or change the existing ones.
Recognized file formats
- In-house 7NMR file format
- Andraž Krajnc developed conversion tool from Bruker NMR data files to 7NMR format
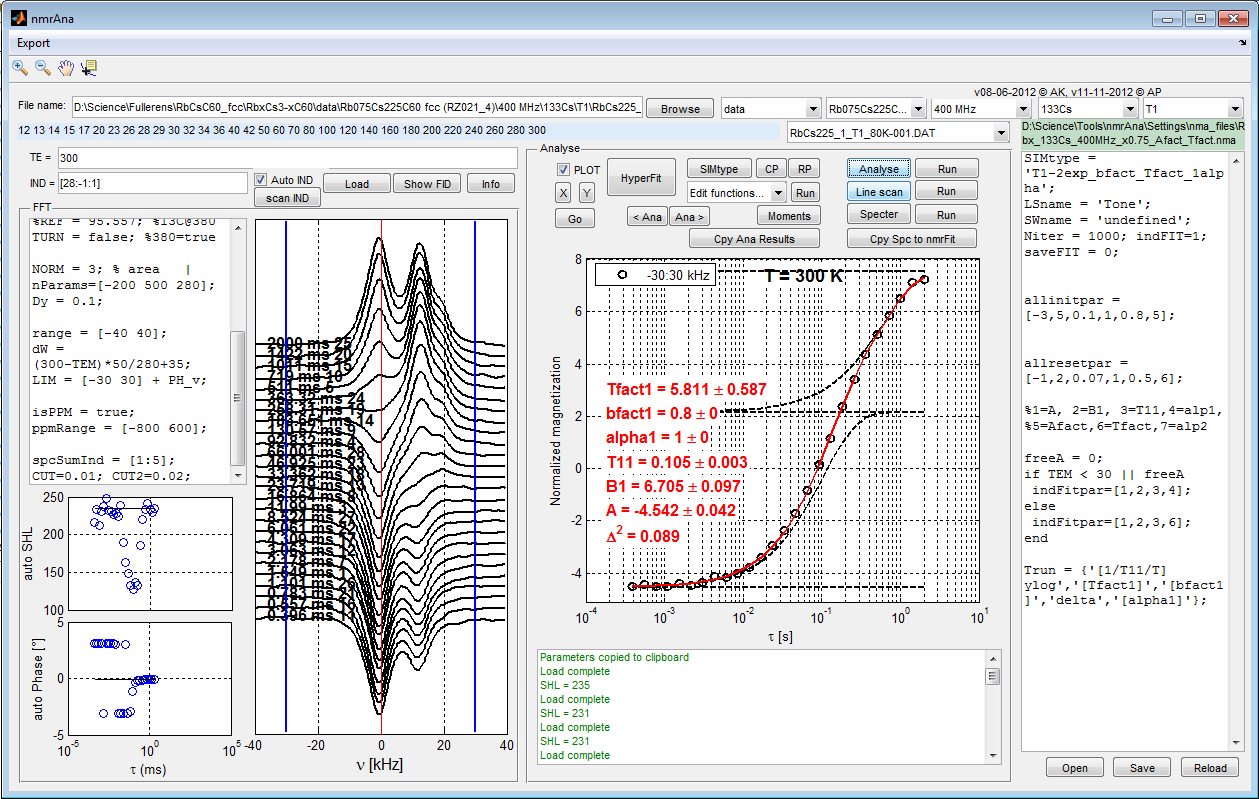
Screen shot
-
- Spin-lattice time analysis
Source Code
Distributed under GNU GPL license. If the analysis obtained by this tool is going to be published in any journal, the authors are required to cite this webpage.
https://github.com/apotocnik/nmrAna
Documentation
FFT parameters
PH_v central frequency for autoPH_SPC
LIM = [left right] integration limits for T1, T2, … analysis
Spectrum parameters
isPPM = true/false convert to ppm
ppmRange = [left right]
nParams = [-left right ampl] range and amplitude parameters
range = [nParams(1) nParams(2)] (ppm or kHz)
NORM Normalization
0: multiply spectrum with nParams(3)
1: divide spectrum by maximal value and multiply it with nParams(3)
2: divide spectrum by maximal value within the range and multiply it with nParams(3)
3: divide spectrum by area within the range and multiply it with nParams(3)
4: multiply spectrum with temperature and nParams(3)
otherwise: multiply spectrum with 1
spcSumInd = [1:5] sum spectra at ordered indeces specified in vector
CUT2 cutoff for moment analysis
Fitting parameters
SIMtype = ‘T1-1mS’ fitting function, see available functions by pressing SIMtype button
Niter number of iterations
indFIT = [1] define vector of limits for fitting. If LIM has more raws indFIT vector can choose which to fit
allinitpar vector of initial parameters. By pressing CP button, allinitpar are substituted by the latest fitting results
allresetpar vector of reset parameters. By pressing RP button, allinitpar is substituted by allresetpar
indFitpar vector of parameter indeces to fit. Parameters with indeces not listed here are kept fix.
Trun = {‘[1/T1/T]ylog’, ‘delta’, ‘[alpha]’} special description of plotted parameters as a function of temperature at the end of Run analysis.
Sweep spectra parameters
SUMdelta frequency step in MHz of summed spectrum
Fmin left cutoff in kHz in summed spectrum
Fmax right cutoff in kHz in summed spectrum
Lmin, Lmax left and right cutoff in kHz for each individual spectrum
Weights (S) are calculated from Spectra between min(LIM) and max(LIM). After running Sweep, weights are calculated from Spectra between Lmin and Lmax.
For more information or bug report please contact me.