eprFit
eprFit is a Matlab-based tool for analysis of electron paramagnetic resonance (EPR) spectra. The program allows to load a series of spectra, typically as a function of temperature, and then perform various analysis on the entire series.
Features
- Spectral moment analysis
- Fitting spectra with analytical functions including errorbar estimates (Curve Fitting Tool)
- Fitting spectra with numerical simulations (fminsearch)
- Background correction
- Spectra multiplication, subtraction, shift, normalization, and binning
- Phase correction and Hilbert transform
- Possible integration with EasySpin
- EPR intensity calibration
Analytical and numerical functions are defined in separate files, so one can easily add new functions.
Recognized file formats
- In-house EPR file format
- Bruker file format (*.DSC, *.DAT)
- High-field EPR formats (NHMFL)
- Plain ASCII (two or three columns, no header)
Screen shots
-
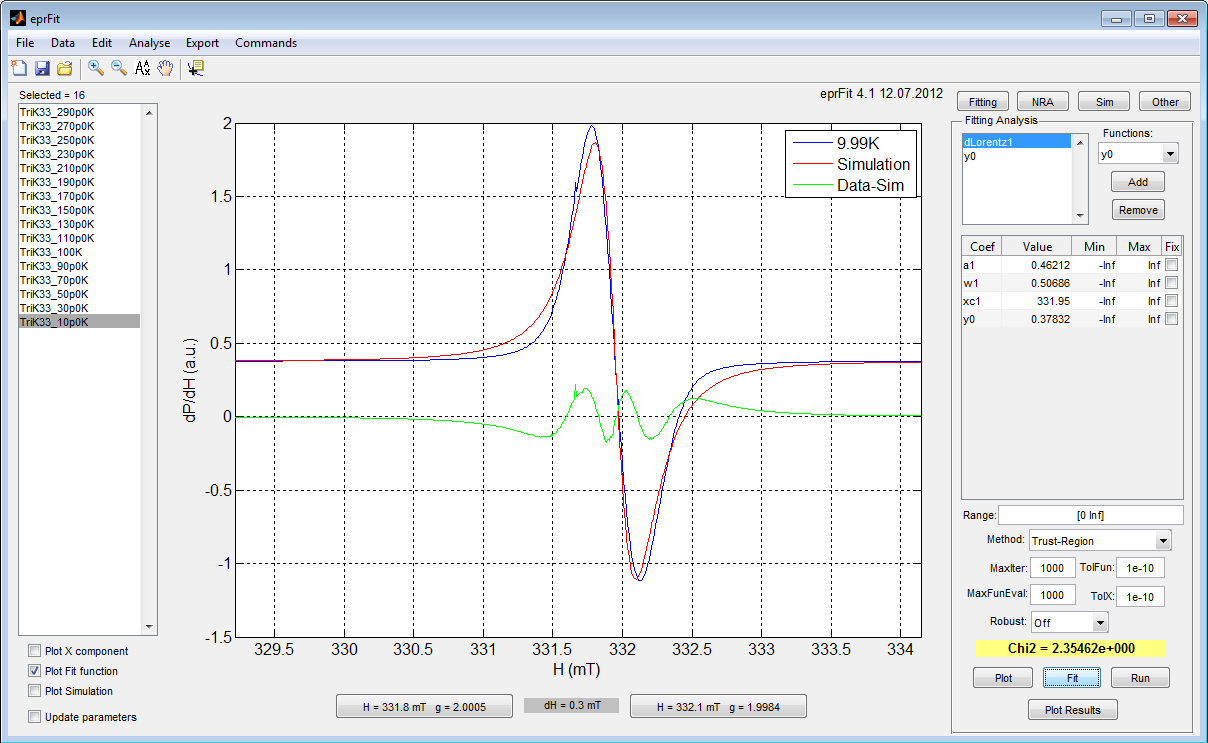
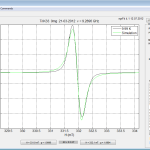
- Fitting analytical functions
-
- Numerical moment analysis
-
- Fitting simulated data
-
- Other features
Source code
Distributed under GNU GPL license. If the analysis obtained by this tool is going to be published in any journal, the authors are required to cite this webpage.
https://github.com/apotocnik/eprFit
What is new?
25. 3. 2014 eprFit4.6
- Improved ascii file reading with column choosing
- Added Gaussian and Lorentzian powder functions
31. 8. 2013 eprFit4.4
- added pseudo Voigt fitting function from Origin library http://www.originlab.com/www/helponline/origin/en/UserGuide/PsdVoigt1.html
- added show components after Plot button is pressed in Fitting panel
- added undo and reundo for Fitting.
- improved undo and reundo for fitting and simulations: if parameters don’t change uicoefs is not saved one more time.
- after fitting is finnished the whole uicoefs is saved under epr.fit.fits{idx}.uiconf, not only parameters. And when update function is called the whole uicoefs is restored. Works only if fitting one spectrum at a time.
- number of fitting functions can now be up to 50, instead of 5.
- when normal functions are added min values are now set to 0 instead to -inf.
- improved remove function: if the function is removed, ones with higher numbers get one number less. So there is no number jump in functions and coefficients.
- when loading ASCII files frequency is set to 0 (instead to 1). When converting xc to g-factor, in case of freq = 0, resulting g-factor in results equals to xc (g=xc). This is necessary for non-EPR spectra.
- removed bug: edit when right-clicking on the filename did not work when only one element was present.
18. 7. 2013 eprFit4.3
- Added the whole new panel for EasySpin and improved compatibility
- Sim panel now has Undo and ReUndo buttons to restore old simulation parameters.
13. 7. 2013 eprFit 4.2
- dGauss function in simulation tab is now corrected.
- dGaussDisp and GaussDisp are added. These two function include calculation of Gaussian dispersion set by phase parameter which mixes absorption and dispersion. These two functions do not work close to H = 0 G, sice the other component (x+xc) would give NaN for narrow spectra. This will be corrected in future.
- When creating new experiment, data is automatically set to now.
12. 7. 2012 eprFit 4.1
- now calibration edit boxes are saved and reloaded on open
Documentation
To start using eprFit, first go to Data->Load Data. One ore more spectra can be selected.
To find the position on a spectra in units of magnetic field or g-factor two pointers are available at the bottom of the program. After a pointer is clicked on the graph the magnetic field value is saved to the clipboard. The magnetic field difference between two pointers is shown in between the two pointer buttons at the bottom.
For plotting, simulating, or fitting first add the appropriate function in the right panel. Definitions of available functions can be found in fun_lib.m or fun_lib_sim.m files for Fitting and Sim panels, respectively. When adding new functions be sure to add the name of a function also in the otherwise casein the switch statement.
Every analysis (Fit, Analyse, or Fit to Data in the right panels) contains Run button which iterates the analysis over the spectra in the left listbox. This process can be stopped only with Ctrl+C key combination in Matlab.
Update parameters checkbox in the left bottom corner if checked updates fitting parameters if they are available. Parameters are updated when new spectre is selected in the left listbox, either by clicking on it or by Run procedure.
Range text box searches for pairs of numbers and plots or analyses only regions defined by these pairs. For example, Range: [300 400 500 600] will plot or analyse spectrum only between 300-400 mT and 500-600 mT.
In the menu Data->Sort will sort spectra in the left listbox according to the temperature parameter.
In the menu Data->Parse Temp will extract values of temperature from the filenames. This is useful when temperatures are not correctly set in the file parameters section.
In the Sim panel Phi step [°]: defines the angle step for powder average simulations. In principle, smaller step means longer computational time and better accuracy. dLorentzPowd and dGaussPowd functions use ZCW method for determining spherical angles distribution.
In the Other panel Phase correction mixes real and imaginary part of data. For X-band measurements with auto frequency control (AFC) real data is always zero. Plotted is always imaginary component which correspond to the absorption of the microwaves in EPR. Hilbert transform mixes absorption and dispersion from single component (imaginary).
In the EasySpin part, by clicking on the Execute button the Exp structure and spc vector containing selected spectrum from the left listbox are loaded before the given file is evaluated. spc does not contain magnetic field values as these can be calculated from fields in the Exp structure.
For more information or bug report please contact me.
3 Comments
I was looking for software to fit using Voigt funcion.(pseudo Voigt fitting function from Origin library). I understand that EPR of solids is beter represented by Lorentzian and solution EPR by Gauss, though the spectra are never pure functions but combinations. Do you have some info on combinations of funtions?
Hey,
peudo Voigt function is implemented in another fitting tools of mine – LeyLa.
See: http://antonpotocnik.com/?p=519
Anton
http://reference.wolfram.com/language/ref/VoigtDistribution.html